Visualize the data structure

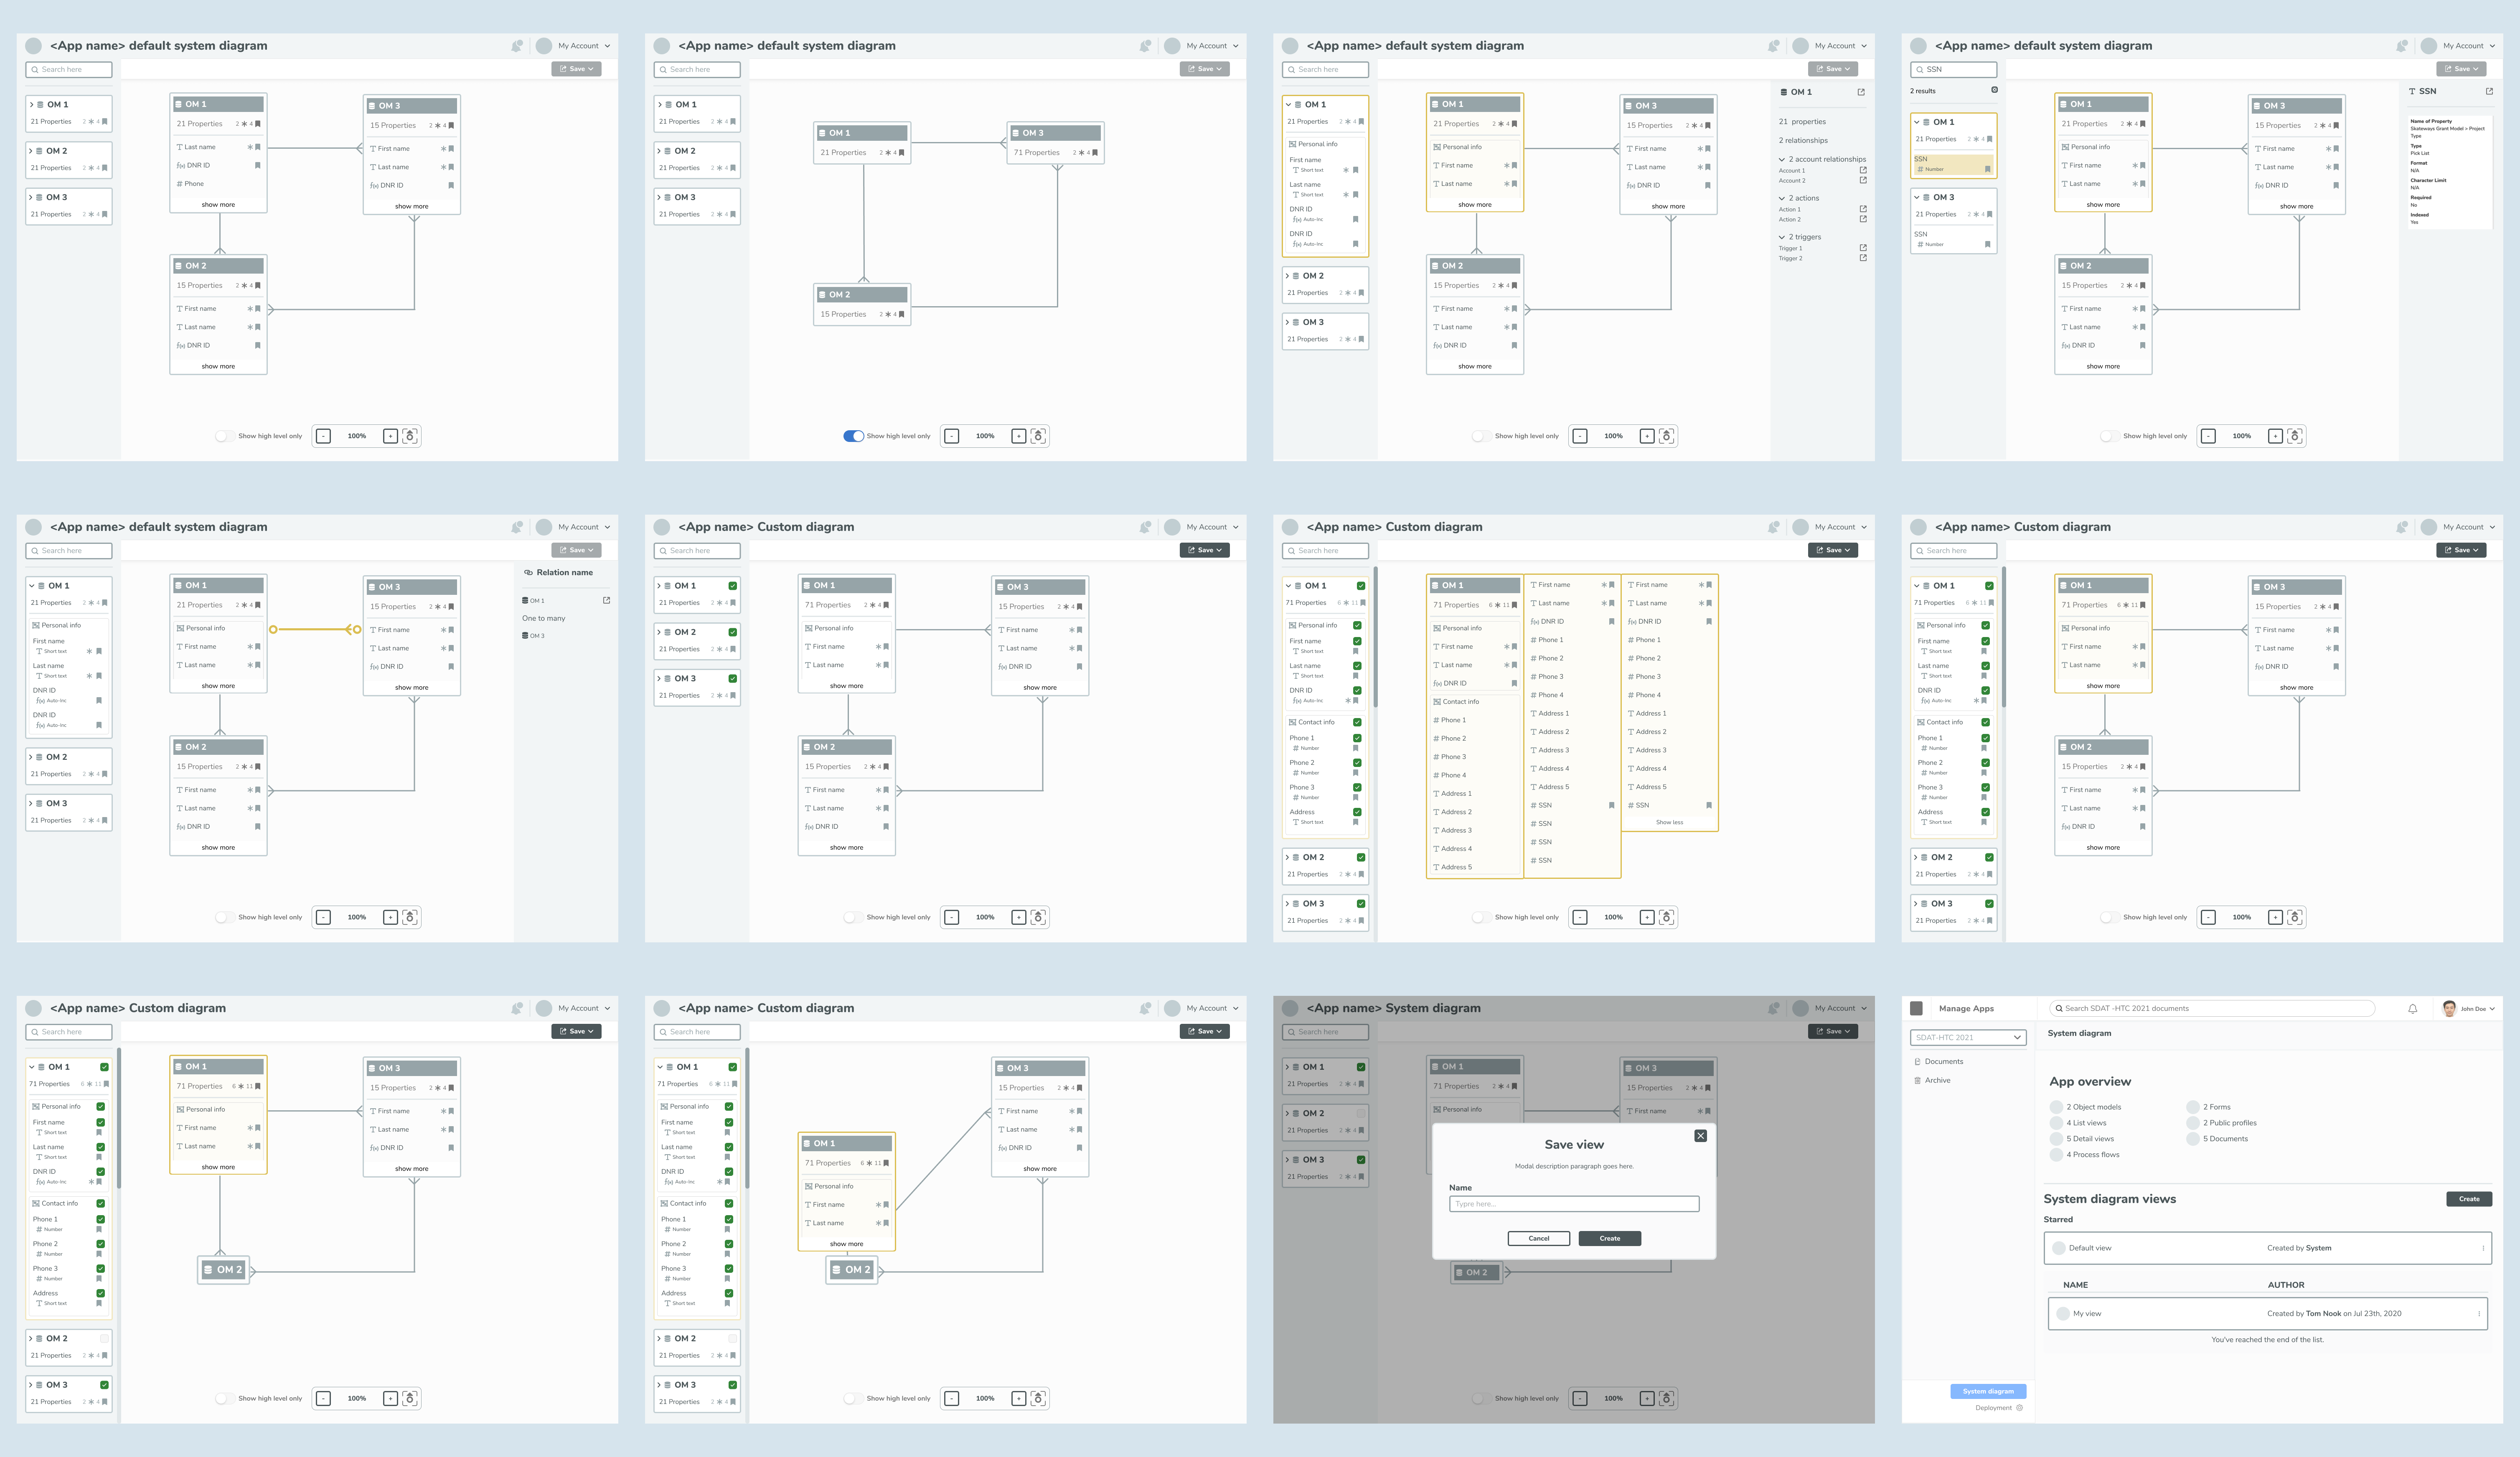
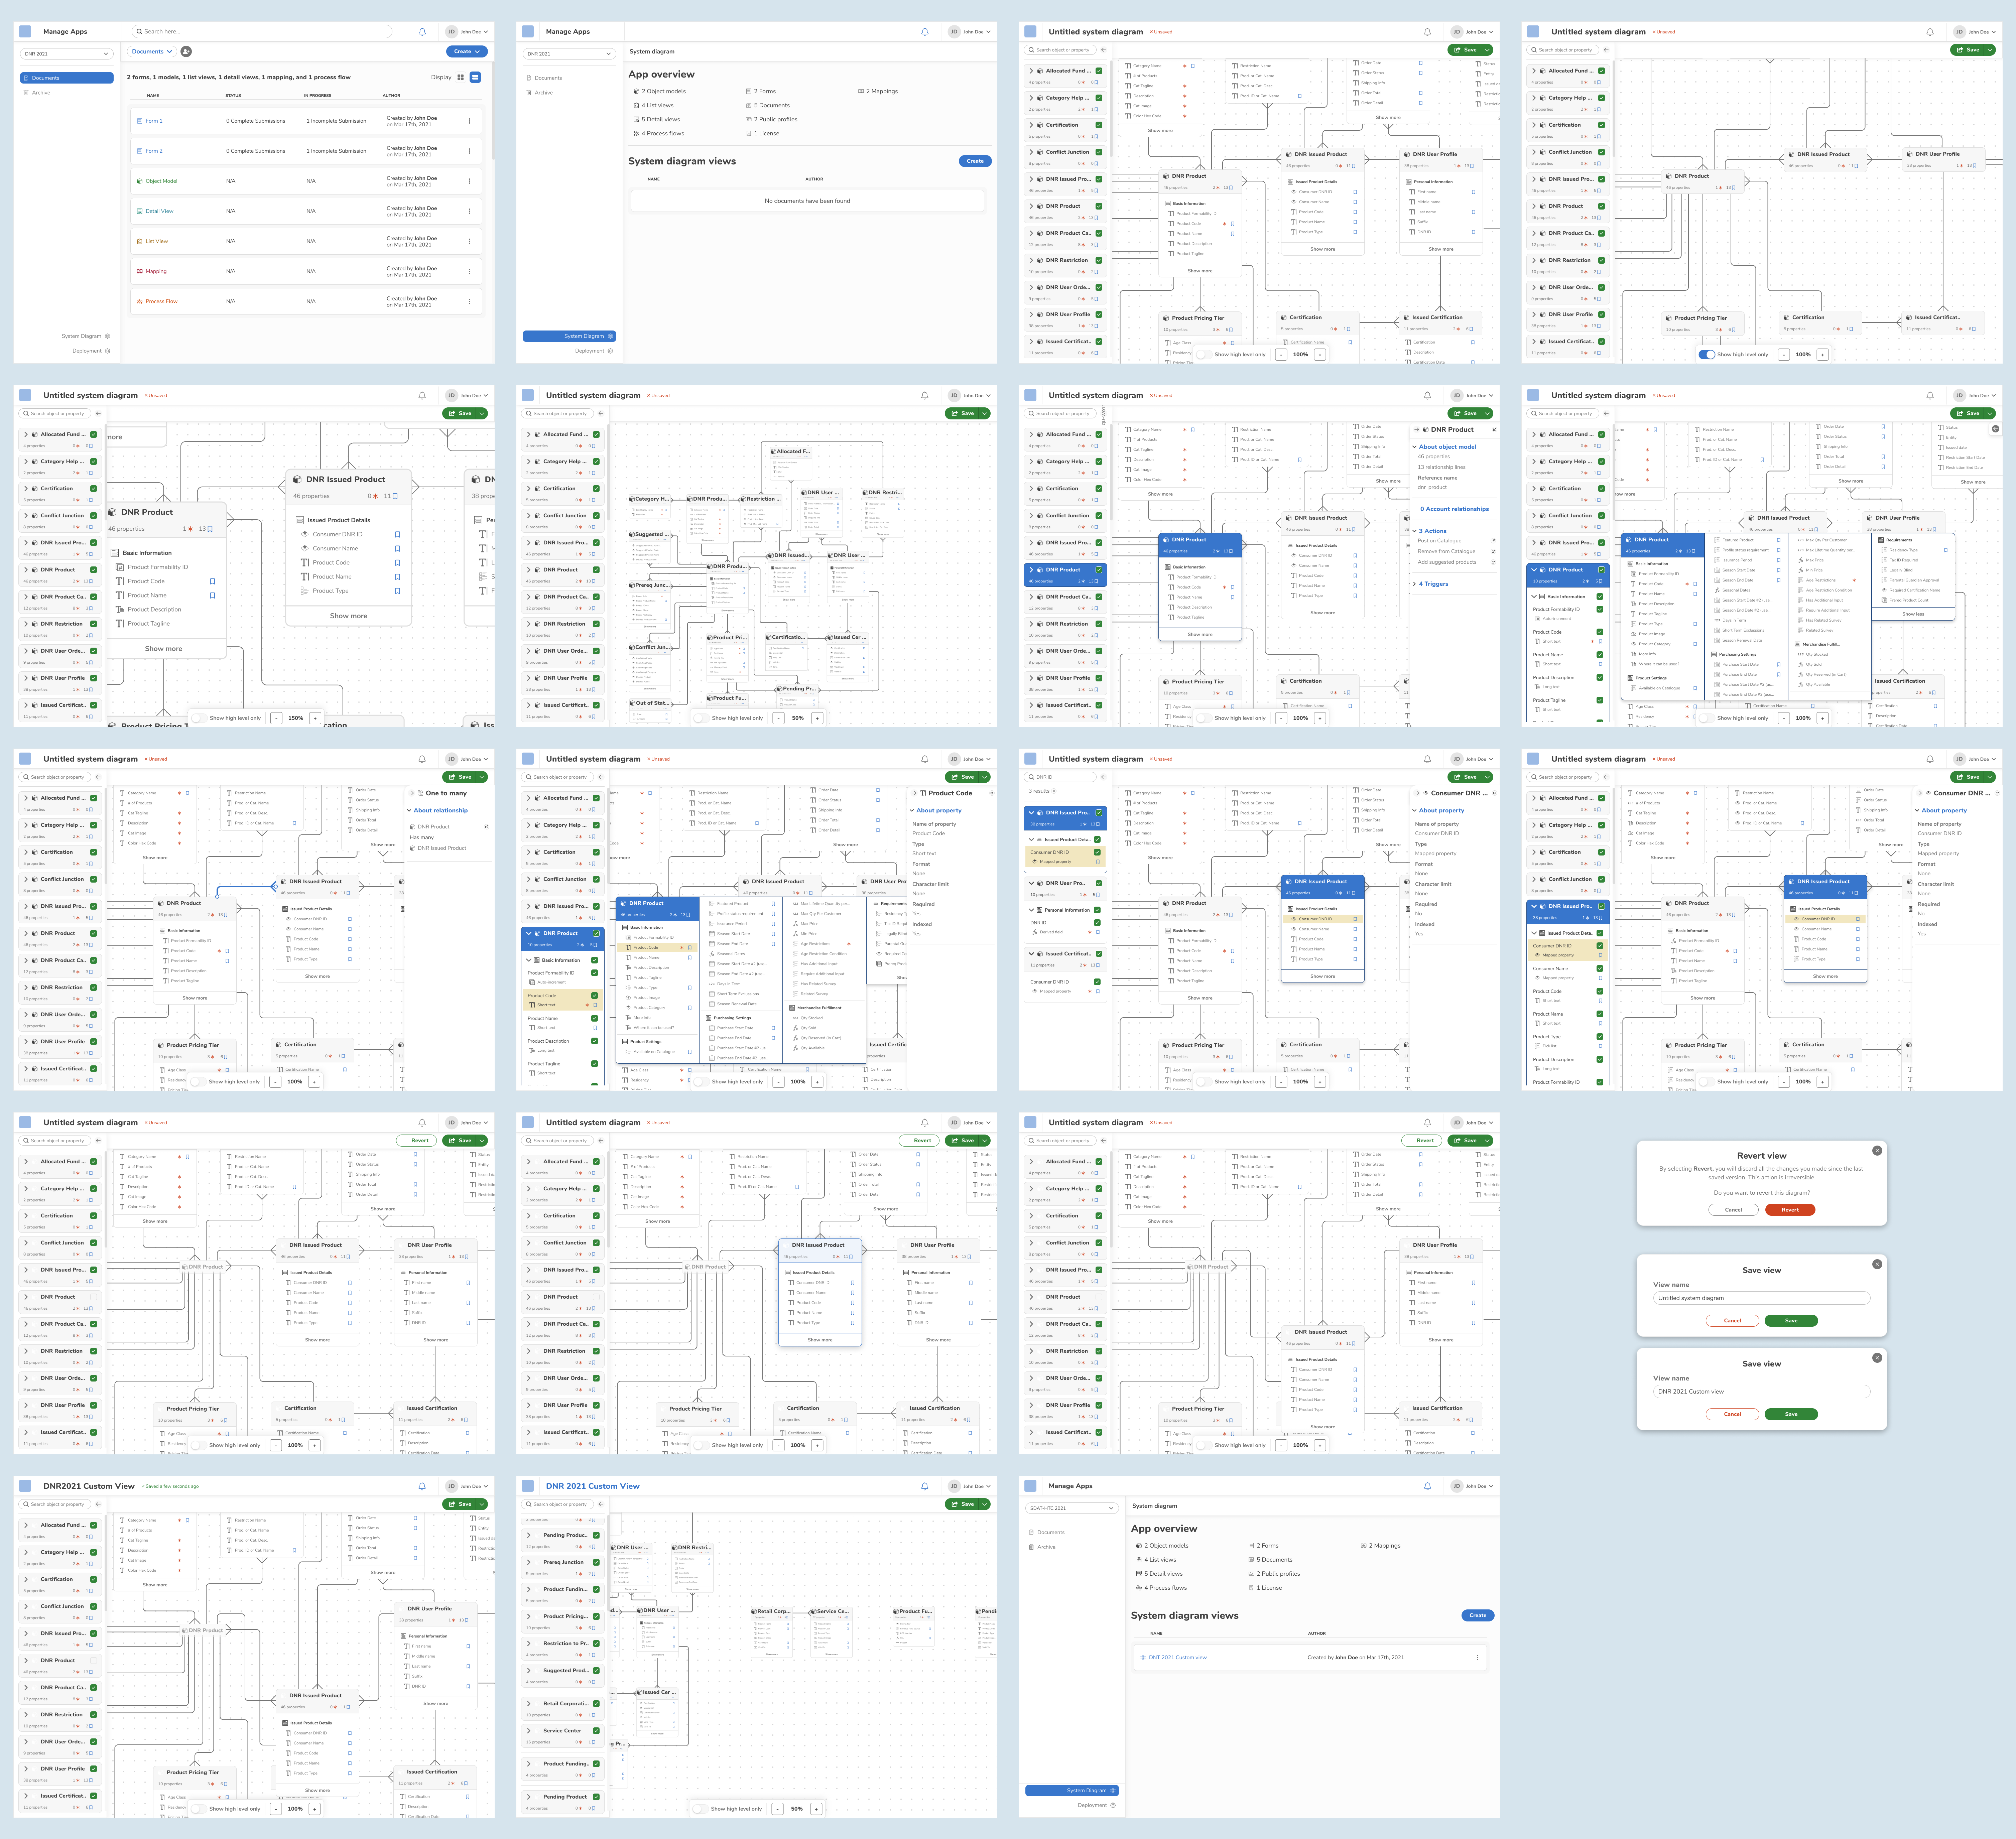
Designed a system diagram builder that can generate visual diagrams based on how users build their data base within the platform.

Feature Overview

We worked on a feature that the system will automatically generate a visual diagram base on how the users build their data structure within an app.

My Role

UX Designer

Time Line

9 weeks / 3 sprints
Mar 14th - May 13th 2022

My Team

1 Product Manager
1 Project Assistant
2 UX Designers
2 Developers

Target user

System architect

As a system architect, I communicate with clients and build forms, workflows, and databases that allow them to review and process applications efficiently.
I want to build a system that can fulfill all the client requirements and feel assured that I am configuring everything correctly.

A desire for powerful functionality

  • Have the ability to build complex logic and data structures to meet the business rules

  • Make sure everything in the process is running correctly

  • Help the client to review and process applications efficiently
ERD user
High level Goal

Create visibility and transparency into what a system contains so we can improve quality and provide guidance on data structure design.

ERD goal
What is an ERD?

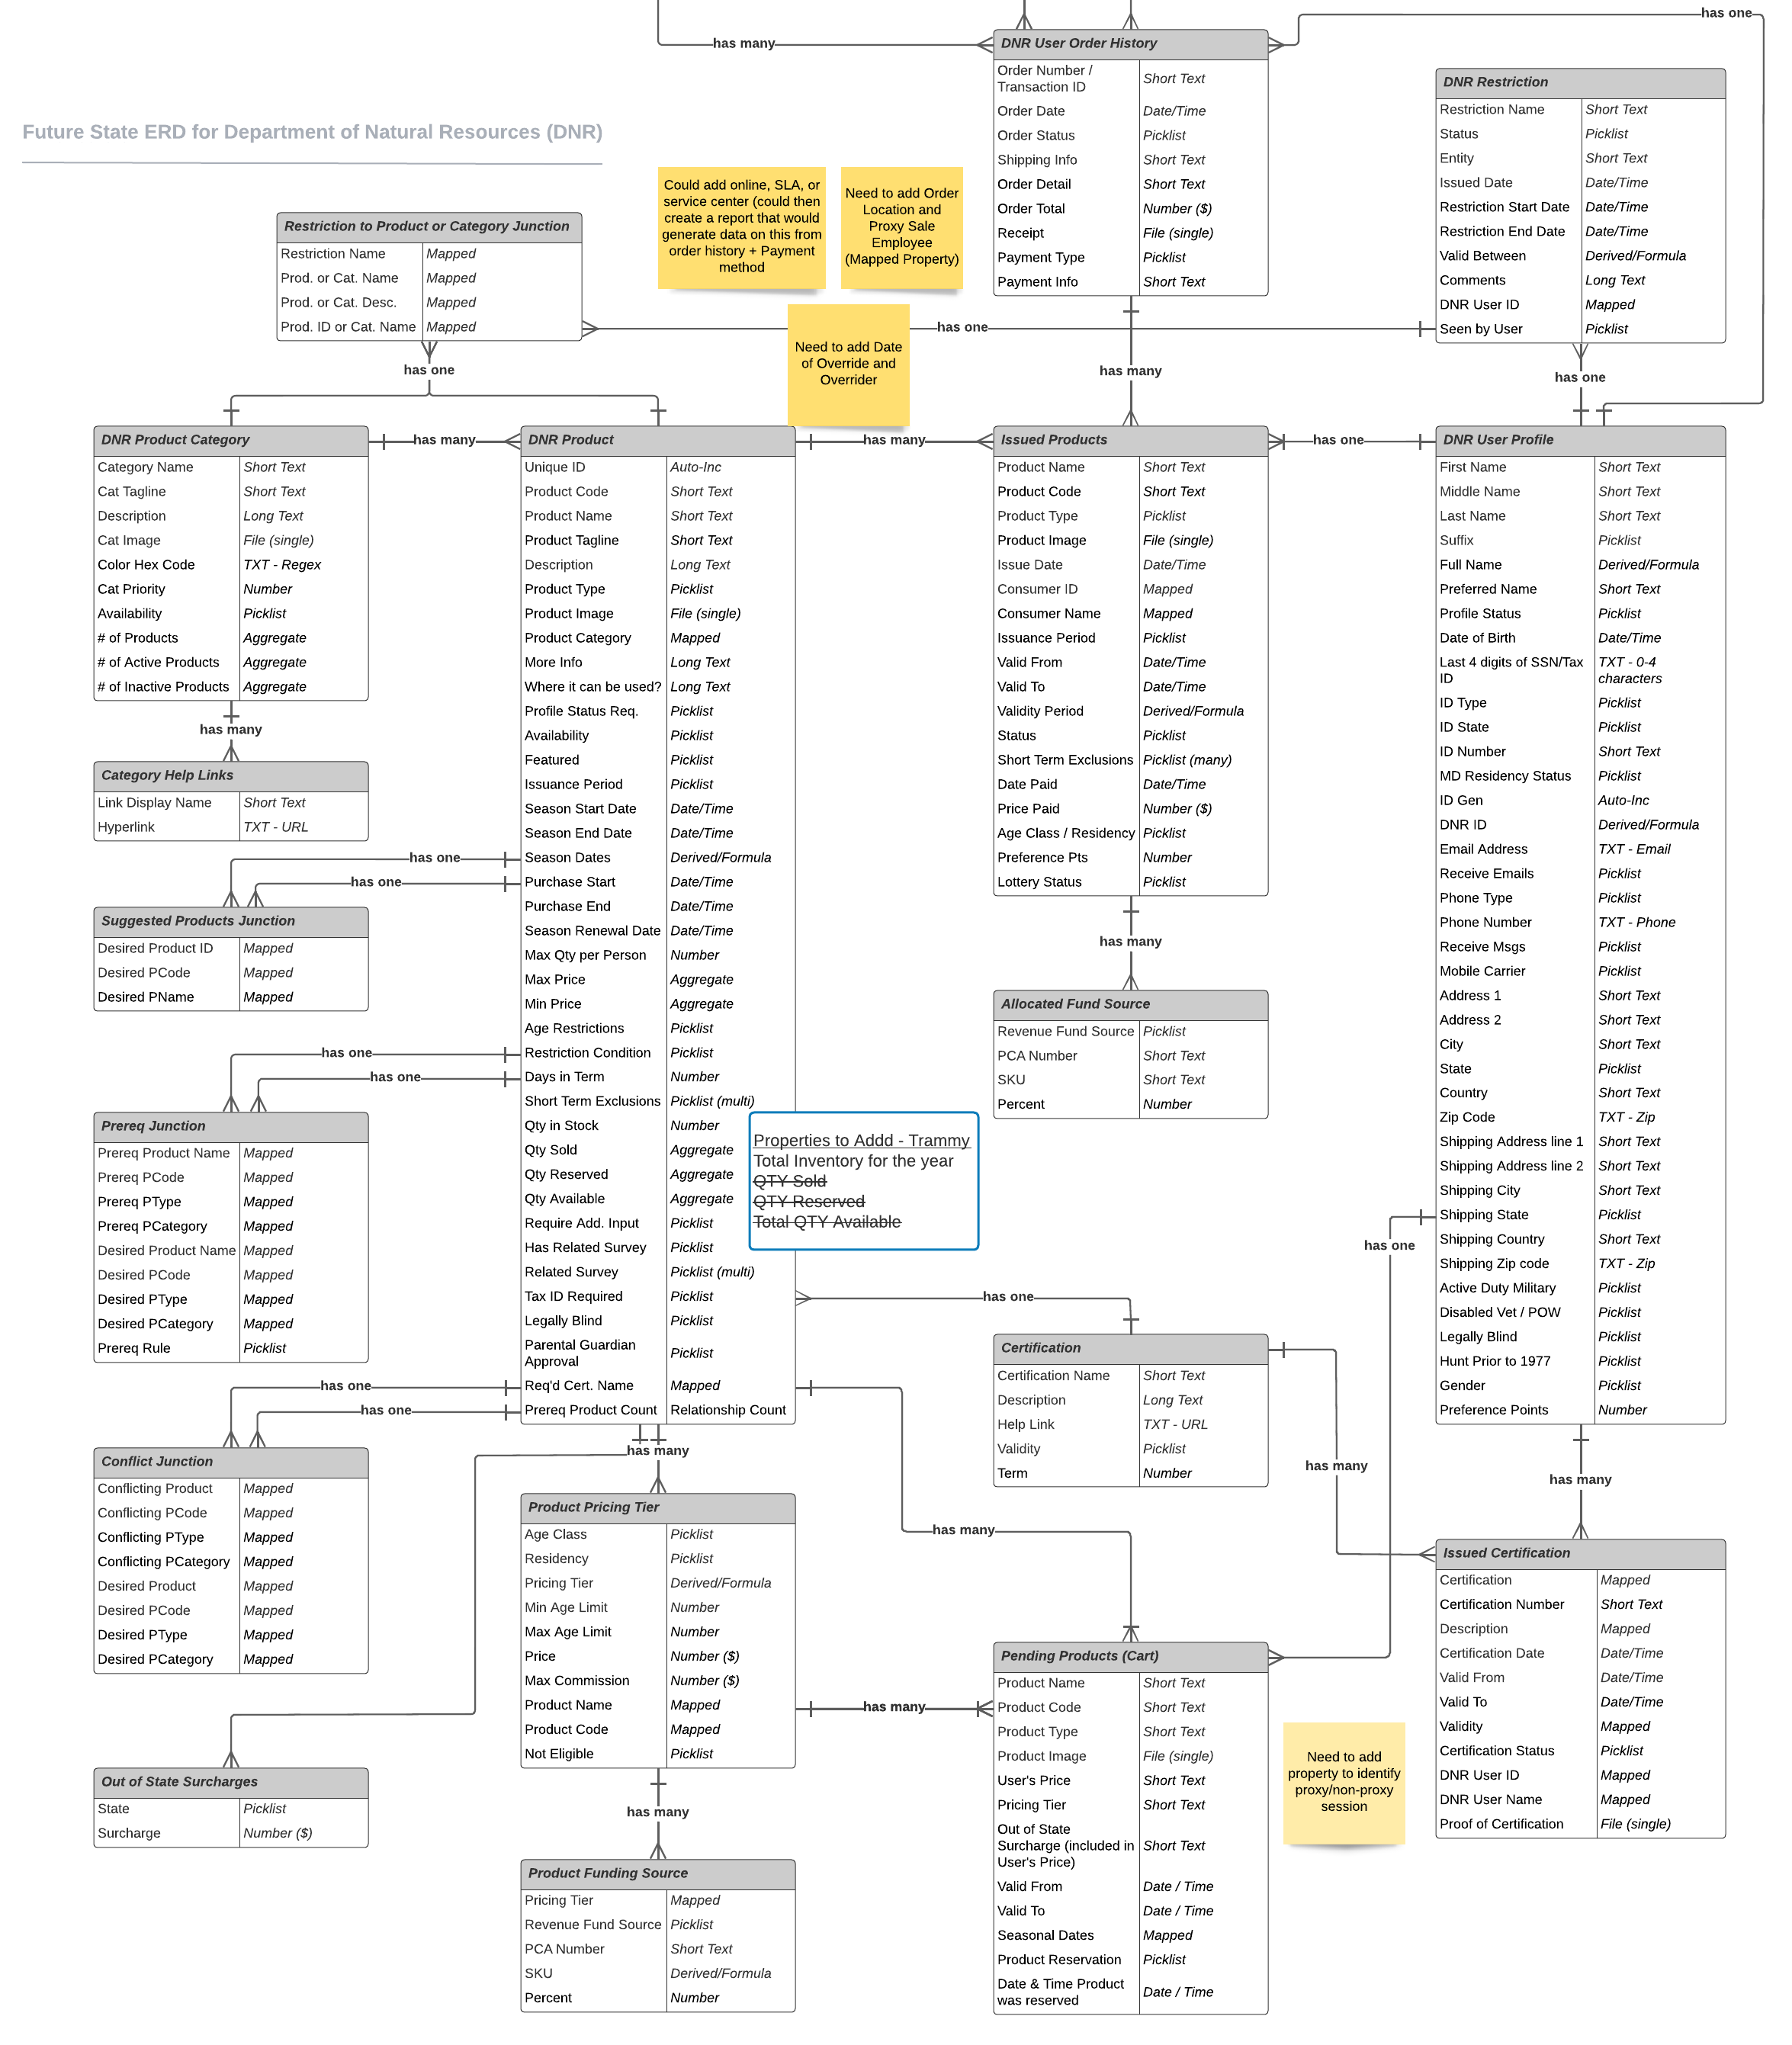
An Entity Relationship (ER) Diagram is a type of flowchart that illustrates how “entities” such as people, objects or concepts relate to each other within a system.

ERDs are used to model and design relational databases, in terms of logic and business rules.

ERDs allow us to see across the entirety of a configuration ecosystem (or “app”) in a way that provides clear and accurate visuals for the users.

ERD example

User journey map

ERD user journey map

Low-fidelity prototype

ERD Lo-fi

Low-fidelity prototype testing

ERD Lo-fi testing notes

Final designs

ERD Hi-fi prototype